Statistical Communique on National Economic and Social Development of the People's Republic of China 2025
National Bureau of Statistics
February 28, 2026
2025 was the final year of the "14th Five-Year Plan" and a year of significant importance in the process of Chinese modernization. Facing profound and complex changes in domestic and international situations, under the strong leadership of the Party Central Committee with Comrade Xi Jinping at its core, all regions and departments adhered to Xi Jinping Thought on Socialism with Chinese Characteristics for a New Era as a guide, fully implemented the spirit of the 20th National Congress of the Communist Party of China and the successive plenary sessions of the 20th Central Committee, followed the decisions and deployments of the Party Central Committee and the State Council, comprehensively and accurately implemented the new development concept, accelerated the construction of a new development pattern, focused on promoting high-quality development, adhered to the general principle of seeking progress while maintaining stability, coordinated the domestic and international overall situations, coordinated development and security, implemented more proactive and effective macro policies, and the Chinese economy advanced under pressure, developed towards new and better directions, the construction of a modern industrial system continued to advance, reform and opening up made new strides, positive progress was made in resolving risks in key areas, people's livelihood security became more robust, the overall social situation remained stable, and a good start was achieved in the new journey towards the second centenary goal.
I. General
Preliminary calculations show that the annual gross domestic product [2] was 14,018.79 billion yuan, an increase of 5.0% over the previous year. Among them, the added value of the primary industry was 933.47 billion yuan, an increase of 3.9% over the previous year; the added value of the secondary industry was 4,996.53 billion yuan, an increase of 4.5%; the added value of the tertiary industry was 8,088.79 billion yuan, an increase of 5.4%. The added value of the primary industry accounted for 6.7% of the gross domestic product, the secondary industry accounted for 35.6%, and the tertiary industry accounted for 57.7%. Final consumption expenditure drove the gross domestic product growth by 2.6 percentage points, capital formation drove the gross domestic product growth by 0.8 percentage points, and net exports of goods and services drove the gross domestic product growth by 1.6 percentage points. On a quarterly basis, the gross domestic product grew by 5.4% year-on-year in the first quarter, 5.2% in the second quarter, 4.8% in the third quarter, and 4.5% in the fourth quarter. The annual per capita gross domestic product was 99,665 yuan, an increase of 5.1% over the previous year. The gross national income [3] was 13,937 billion yuan, an increase of 5.1% over the previous year. The labor productivity of all employees [4] was 184,413 yuan per person, an increase of 6.1% over the previous year.


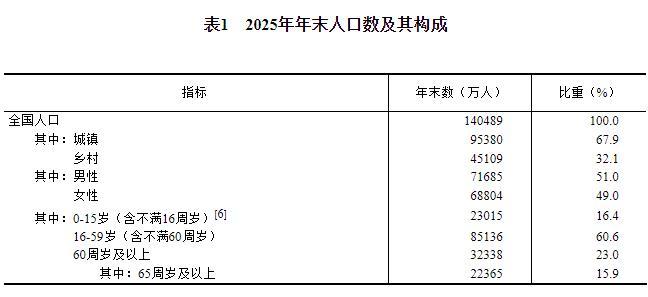
At the end of the year, the national population [5] was 1,404.89 million, a decrease of 3.39 million from the end of the previous year, of which the urban permanent population was 953.80 million. The annual birth population was 7.92 million, with a birth rate of 5.63‰; the death population was 11.31 million, with a death rate of 8.04‰; the natural growth rate was -2.41‰.
At the end of the year, the national employed population was 725.04 million, of which the urban employed population was 475.35 million, accounting for 65.6% of the national employed population. The annual new urban employment [7] was 12.67 million, an increase of 1.1 million over the previous year. The annual average urban surveyed unemployment rate was 5.2%. At the end of the year, the urban surveyed unemployment rate was 5.1%. The total number of migrant workers [8] nationwide was 301.15 million, an increase of 0.5% over the previous year. Among them, 180.06 million were migrant workers working outside their hometowns, an increase of 0.8%; 121.09 million were local migrant workers, an increase of 0.1%.

The annual consumer price index remained unchanged from the previous year. The producer price index for industrial products fell by 2.6%. The purchase price index for industrial producers fell by 3.0%. The producer price index for agricultural products [9] fell by 3.7%. In December, among 70 large and medium-sized cities, the number of cities where the sales prices of newly built commercial residential buildings rose month-on-month was 6, remained unchanged in 6, and fell in 58; the number of cities where the sales prices of second-hand residential buildings fell month-on-month was 70; the number of cities where the sales prices of newly built commercial residential buildings rose year-on-year was 5, and fell in 65; the number of cities where the sales prices of second-hand residential buildings fell year-on-year was 70.

At the end of the year, the national foreign exchange reserves were 3,357.9 billion US dollars, an increase of 155.5 billion US dollars from the end of the previous year. The annual average exchange rate of the renminbi was 7.1429 yuan per US dollar, a depreciation of 0.3% from the previous year.

New quality productivity grew steadily. The annual added value of the equipment manufacturing industry [12] in industries above designated size [11] increased by 9.2% over the previous year, accounting for 36.8% of the added value of industries above designated size; the profits of equipment manufacturing enterprises increased by 7.7%. The added value of high-tech manufacturing [13] increased by 9.4%, accounting for 17.1% of the added value of industries above designated size; the profits of high-tech manufacturing enterprises increased by 13.3%. The added value of the digital product manufacturing industry [14] increased by 9.3%, accounting for 12.5% of the added value of industries above designated size. The output of service robots was 18.581 million units, an increase of 16.1% over the previous year; the output of mobile communication base station equipment was 5.364 million radio frequency modules, an increase of 13.5%; the output of servers was 5.970 million units, an increase of 12.6%. Among some service industries above designated size [15], the operating income of strategic emerging service industries [16] increased by 9.3% over the previous year, and the operating income of high-tech service industries [17] increased by 7.9%. The e-commerce transaction volume [18] was 46,733.9 billion yuan, an increase of 2.5% over the previous year. The online retail sales [19] were 15,972.2 billion yuan, an increase of 8.6% over the previous year. In fixed asset investment (excluding farmers) [20], investment in equipment and tools increased by 11.8% over the previous year. The annual number of newly established business entities was 25.74 million, with an average of 26,000 new enterprises established daily.
Urban-rural integration and regional coordinated development were steadily advanced. At the end of the year, the urbanization rate of the national permanent population was 67.89%, an increase of 0.89 percentage points from the end of the previous year. By region [21], the annual gross domestic product of the eastern region was 7,308.76 billion yuan, an increase of 5.0% over the previous year; the central region's gross domestic product was 2,991.08 billion yuan, an increase of 5.2%; the western region's gross domestic product was 2,987.50 billion yuan, an increase of 5.1%; the northeastern region's gross domestic product was 650.35 billion yuan, an increase of 4.1%. The annual gross domestic product of the Beijing-Tianjin-Hebei region was 1,199.18 billion yuan, an increase of 5.4% over the previous year; the gross domestic product of the Yangtze River Economic Belt region was 6,583.36 billion yuan, an increase of 5.2%; the gross domestic product of the Yangtze River Delta region was 3,465.95 billion yuan, an increase of 5.4%. New progress was made in the implementation of major regional strategies such as the construction of the Guangdong-Hong Kong-Macao Greater Bay Area and the ecological protection and high-quality development of the Yellow River Basin. The Hainan Free Trade Port launched island-wide customs closure operations.

The results of the green and low-carbon transition were remarkable. Preliminary estimates show that the annual carbon dioxide emissions per 10,000 yuan of gross domestic product [22] fell by 5.0% from the previous year. The power generation of clean energy such as hydropower, nuclear power, wind power, and solar power was 4,248.1 billion kilowatt-hours, an increase of 14.4% over the previous year. The output of new energy vehicles was 16.524 million units, an increase of 25.1% over the previous year; at the end of the year, the number of new energy vehicles in use was 43.97 million, an increase of 12.57 million from the end of the previous year. Among the 339 cities at the prefecture level and above monitored, 72.6% of the cities met air quality standards. Among the 3,641 national surface water assessment sections, the proportion of sections with excellent water quality (Class I-III) was 91.4%, Class IV sections accounted for 6.9%, Class V sections accounted for 1.1%, and sections worse than Class V accounted for 0.6%.
II. Agriculture
The annual grain sown area was 119.41 million hectares, an increase of 90,000 hectares over the previous year. Among them, the sown area of rice was 29.01 million hectares, an increase of 10,000 hectares; the sown area of wheat was 23.58 million hectares, a decrease of 10,000 hectares; the sown area of corn was 44.96 million hectares, an increase of 220,000 hectares; the sown area of soybeans was 10.26 million hectares, a decrease of 70,000 hectares. The sown area of cotton was 2.98 million hectares, an increase of 140,000 hectares. The sown area of oilseeds was 14.45 million hectares, an increase of 160,000 hectares. The sown area of sugar crops was 1.49 million hectares, an increase of 30,000 hectares.
The annual grain output was 714.88 million tons, an increase of 8.38 million tons over the previous year, an increase of 1.2%. Among them, the summer grain output was 149.75 million tons, a decrease of 0.1%; the early rice output was 28.51 million tons, an increase of 1.2%; the autumn grain output was 536.62 million tons, an increase of 1.5%. The output of cereals was 660.21 million tons, an increase of 1.2% over the previous year. Among them, the output of rice was 209.04 million tons, an increase of 0.7%; the output of wheat was 140.07 million tons, basically unchanged; the output of corn was 301.24 million tons, an increase of 2.1%. The output of soybeans was 20.91 million tons, an increase of 1.3% over the previous year.

The annual cotton output was 6.64 million tons, an increase of 7.7% over the previous year. The output of oilseeds was 40.96 million tons, an increase of 2.9%. The output of sugar crops was 117.01 million tons, an increase of 2.1%. The output of tea was 3.92 million tons, an increase of 4.8%.
The annual output of pork, beef, mutton, and poultry was 100.72 million tons, an increase of 4.2% over the previous year. Among them, the output of pork was 59.38 million tons, an increase of 4.1%; the output of beef was 8.01 million tons, an increase of 2.8%; the output of mutton was 4.96 million tons, a decrease of 4.2%; the output of poultry was 28.37 million tons, an increase of 6.7%. The output of poultry eggs was 34.98 million tons, a decrease of 2.5%. The output of milk was 40.91 million tons, an increase of 0.3%. At the end of the year, the number of pigs in stock was 429.67 million, an increase of 0.5% over the end of the previous year; the annual number of pigs slaughtered was 719.73 million, an increase of 2.4% over the previous year.
The annual total output of aquatic products was 76.57 million tons, an increase of 4.1% over the previous year. Among them, the output of aquaculture was 63.24 million tons, an increase of 4.4%; the output of fishing was 13.33 million tons, an increase of 2.7%.
The annual output of timber was 139.37 million cubic meters, a decrease of 1.1% from the previous year.
III. Industry and Construction
The annual added value of all industries was 41,682.6 billion yuan, an increase of 5.8% over the previous year. The added value of industries above designated size increased by 5.9%. In industries above designated size, by economic type, the added value of state-controlled enterprises increased by 4.6%; joint-stock enterprises increased by 6.3%, foreign-invested and Hong Kong, Macao, and Taiwan-invested enterprises increased by 3.9%; private enterprises increased by 5.3%. By category, the mining industry increased by 5.6%, the manufacturing industry increased by 6.4%, and the production and supply of electricity, heat, gas, and water increased by 2.3%.

In industries above designated size, the added value of the agricultural and sideline food processing industry increased by 5.6% over the previous year, the textile industry increased by 3.0%, the chemical raw materials and chemical products manufacturing industry increased by 7.8%, the non-metallic mineral products industry decreased by 0.6%, the ferrous metal smelting and rolling processing industry increased by 4.5%, the general equipment manufacturing industry increased by 8.0%, the special equipment manufacturing industry increased by 4.3%, the automobile manufacturing industry increased by 11.5%, the electrical machinery and equipment manufacturing industry increased by 9.2%, the computer, communication and other electronic equipment manufacturing industry increased by 10.6%, and the production and supply of electricity and heat increased by 2.2%.

The annual profits of industrial enterprises above designated size [25] were 7,398.2 billion yuan, an increase of 0.6% over the previous year. By economic type, the profits of state-controlled enterprises were 2,056.1 billion yuan, a decrease of 3.9%; joint-stock enterprises were 5,540.8 billion yuan, a decrease of 0.1%, foreign-invested and Hong Kong, Macao, and Taiwan-invested enterprises were 1,744.7 billion yuan, an increase of 4.2%; private enterprises were 2,281.1 billion yuan, unchanged from the previous year. By category, the profits of the mining industry were 834.5 billion yuan, a decrease of 26.2%; the manufacturing industry was 5,691.6 billion yuan, an increase of 5.0%; the production and supply of electricity, heat, gas, and water were 872.1 billion yuan, an increase of 9.4%. The cost per 100 yuan of operating income for industrial enterprises above designated size was 85.31 yuan, an increase of 0.16 yuan from the previous year; the operating income profit margin was 5.31%, a decrease of 0.03 percentage points. At the end of the year, the asset-liability ratio of industrial enterprises above designated size was 57.6%, a decrease of 0.1 percentage points from the end of the previous year. The annual capacity utilization rate [26] of industrial enterprises above designated size was 74.4%.
Preliminary calculations show that the annual total production of primary energy was 5.13 billion tons of standard coal, an increase of 3.6% over the previous year.

At the end of the year, the national installed power generation capacity was 3,891.34 million kilowatts, an increase of 16.1% from the end of the previous year. Among them [28], the installed capacity of thermal power was 1,539.04 million kilowatts, an increase of 6.3%; the installed capacity of hydropower was 448.02 million kilowatts, an increase of 2.9%; the installed capacity of nuclear power was 62.48 million kilowatts, an increase of 2.7%; the installed capacity of wind power was 640.01 million kilowatts, an increase of 22.9%; the installed capacity of solar power generation was 1,201.73 million kilowatts, an increase of 35.4%.
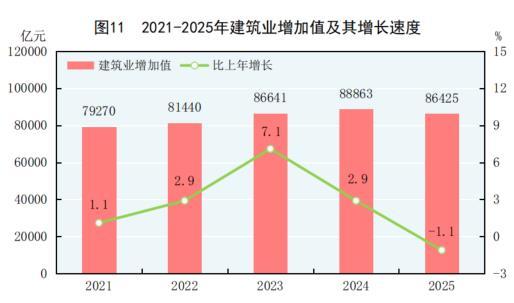
The annual added value of the construction industry was 8,642.5 billion yuan, a decrease of 1.1% from the previous year. The profits of general contracting and professional contracting construction enterprises with qualification grades nationwide were 635.5 billion yuan, a decrease of [29] 14.1% from the previous year, of which the profits of state-controlled enterprises were 347.3 billion yuan, a decrease of 8.2%.
IV. Service Industry
The annual added value of the wholesale and retail industry was 14,580.8 billion yuan, an increase of 5.0% over the previous year; the added value of the transportation, storage, and postal industry was 6,209.2 billion yuan, an increase of 5.2%; the added value of the accommodation and catering industry was 2,640.3 billion yuan, an increase of 4.9%; the added value of the financial industry was 10,133.7 billion yuan, an increase of 4.5%; the added value of the real estate industry was 8,302.4 billion yuan, an increase of 0.2%; the added value of the information transmission, software, and information technology service industry was 7,059.9 billion yuan, an increase of 11.1%; the added value of the leasing and business service industry was 6,366.6 billion yuan, an increase of 10.3%. The operating income of some service industry enterprises above designated size [30] increased by 6.8% over the previous year, and the total profit increased by 1.9%.

The annual total volume of goods transported [31] was 59.7 billion tons, an increase of 3.2% over the previous year. The turnover of goods transported was 27,411.6 billion ton-kilometers, an increase of 4.6%. The total cargo throughput of ports was 18.3 billion tons, an increase of 4.2% over the previous year, of which the foreign trade cargo throughput was 5.7 billion tons, an increase of 4.7%. The container throughput of ports was 354.47 million TEUs, an increase of 6.8%.

The annual total passenger transport [32] was 17.1 billion person-times, an increase of 0.3% over the previous year. The turnover of passenger transport was 3,554.6 billion person-kilometers, an increase of 5.0%.

At the end of the year, the national civilian vehicle ownership was 366.11 million (including 6.81 million three-wheeled vehicles and low-speed trucks), an increase of 13.43 million from the end of the previous year, of which private vehicle ownership was 323.36 million, an increase of 13.48 million. The ownership of civilian cars was 197.73 million, an increase of 4.29 million, of which private car ownership was 186.91 million, an increase of 4.87 million.
The annual total volume of postal industry delivery business [33] was 216.5 billion pieces, an increase of 11.8% over the previous year. The postal industry completed 680 million postal letter services, 30 million parcel services, 199 billion express delivery services, and express delivery revenue was 1,493.9 billion yuan. The annual total volume of telecommunications business [34] was 1,862.7 billion yuan, an increase of 9.1% over the previous year. At the end of the year, the number of mobile phone base stations [35] was 12.87 million, of which 4G base stations were 7.19 million, and 5G base stations were 4.84 million. The national mobile phone users were 1,826.84 million, of which 5G mobile phone users were 1,204.13 million. The mobile phone penetration rate was 130.0 units per 100 people. The number of fixed internet broadband access users [36] was 690.82 million, an increase of 20.99 million from the end of the previous year, of which broadband access users with a speed of 1000M and above [37] were 238.39 million, an increase of 31.57 million. The number of mobile IoT terminal users [38] was 2.888 billion, an increase of 232 million. The number of internet users was 1.125 billion, of which the number of mobile internet users was 1.121 billion. The internet penetration rate was 80.1%, of which the internet penetration rate in rural areas was 69.5%. The annual mobile internet user access traffic was 395.8 billion GB, an increase of 17.3% over the previous year. The software and information technology service industry [39] completed software business revenue of 15,483.1 billion yuan, an increase of 13.2% over the previous year.

V. Domestic Trade
The annual total retail sales of consumer goods were 50,120.2 billion yuan, an increase of 3.7% over the previous year. By location of operation, the retail sales of consumer goods in urban areas were 43,297.2 billion yuan, an increase of 3.6%; the retail sales of consumer goods in rural areas were 6,823 billion yuan, an increase of 4.1%. By type of consumption, the retail sales of goods were 44,322 billion yuan, an increase of 3.8%; catering revenue was 5,798.2 billion yuan, an increase of 3.2%. The retail sales of services [41] increased by 5.5% over the previous year.

Among the retail sales of goods by units above designated size for the year, the retail sales of grain, oil, and food increased by 9.3% over the previous year, beverages increased by 1.0%, tobacco and alcohol increased by 2.7%, clothing, shoes, hats, and textiles increased by 3.2%, cosmetics increased by 5.1%, gold, silver, and jewelry increased by 12.8%, daily necessities increased by 6.3%, sports and entertainment products increased by 15.7%, household appliances and audio-visual equipment increased by 11.0%, Chinese and Western medicines increased by 1.8%, cultural and office supplies increased by 17.3%, furniture increased by 14.6%, communication equipment increased by 20.9%, petroleum and products decreased by 5.7%, automobiles decreased by 1.5%, building and decoration materials decreased by 2.7%. By retail format, among units above designated size, the retail sales of convenience stores increased by 5.5% over the previous year, specialty stores increased by 2.6%, supermarkets increased by 4.3%, department stores increased by 0.1%, and brand specialty stores decreased by 0.6%.
The annual online retail sales of physical goods [42] were 13,092.3 billion yuan, an increase of 5.2% over the previous year, accounting for 26.1% of the total retail sales of consumer goods.
VI. Fixed Asset Investment
The total fixed asset investment for the whole society throughout the year was 49,110.9 billion yuan, a decrease of 3.9% compared to the previous year. Fixed asset investment (excluding households) was 48,518.6 billion yuan, a decrease of 3.8%. In fixed asset investment (excluding households), by region, investment in the eastern region decreased by 8.4%, the central region decreased by 2.7%, the western region decreased by 1.3%, and the northeastern region decreased by 15.5%.
In fixed asset investment (excluding households), investment in the primary industry was 957 billion yuan, an increase of 2.3% compared to the previous year; investment in the secondary industry was 17,736.8 billion yuan, an increase of 2.5%; investment in the tertiary industry was 29,824.8 billion yuan, a decrease of 7.4%. Infrastructure investment decreased by 2.2%. Investment in social sectors decreased by 8.5%. Private investment decreased by 6.4%, and private project investment excluding real estate development decreased by 1.9%. By sector, private investment in manufacturing decreased by 0.2%, while private investment in infrastructure increased by 1.7%.


Real estate development investment for the year was 8,278.8 billion yuan, a decrease of 17.2% compared to the previous year. Among this, residential investment was 6,351.4 billion yuan, a decrease of 16.3%; office building investment was 320.3 billion yuan, a decrease of 22.8%; commercial business property investment was 594.7 billion yuan, a decrease of 14.0%. The total area of newly built commercial housing sold throughout the year was 881.01 million square meters. The net signed area of second-hand housing transactions was 736.85 million square meters. At the end of the year, the area of newly built commercial housing available for sale was 766.32 million square meters, including 402.36 million square meters of commercial residential housing available for sale.

Throughout the year, 1.21 million units (rooms) of allocated affordable housing, affordable rental housing, and public rental housing were started and collected; 170,000 units of urban dilapidated housing were started for renovation; 27,000 old urban communities were newly started for renovation, benefiting 4.99 million households; 219,000 rural households, including low-income groups and key targets, started renovation of rural dilapidated housing and earthquake-resistant housing.
VII. Foreign Economy
The total import and export of goods for the year was 45,468.5 billion yuan, an increase of 3.8% compared to the previous year. Among this, exports were 26,989 billion yuan, an increase of 6.1%; imports were 18,479.5 billion yuan, an increase of 0.5%. The trade surplus of goods was 8,509.4 billion yuan. The import and export volume with countries participating in the Belt and Road Initiative was 23,601.8 billion yuan, an increase of 6.3% compared to the previous year, accounting for 51.9% of the total import and export volume. Among this, exports were 13,685.1 billion yuan, an increase of 11.2%; imports were 9,916.7 billion yuan, an increase of 0.1%. The import and export volume with other member countries of the Regional Comprehensive Economic Partnership (RCEP) was 13,850.3 billion yuan, an increase of 5.3% compared to the previous year. The import and export volume of private enterprises was 26,040.3 billion yuan, an increase of 7.1% compared to the previous year, accounting for 57.3% of the total import and export volume; among this, exports were 17,659.2 billion yuan, an increase of 7.2%.


The total import and export of services for the year was 8,082.3 billion yuan, an increase of 7.4% compared to the previous year. Among this, exports were 3,626.8 billion yuan, an increase of 14.2%; imports were 4,455.5 billion yuan, an increase of 2.5%. The trade deficit of services was 828.7 billion yuan.
Throughout the year, 70,392 new foreign-invested enterprises were established, an increase of 19.1% compared to the previous year. The actual use of foreign capital was 747.7 billion yuan, a decrease of 9.5%. Among this, countries participating in the Belt and Road Initiative (including investment in China through some free ports) established 19,756 new foreign-invested enterprises in China, an increase of 14.7%; direct investment in China was 116.8 billion yuan, an increase of 1.9%. The actual use of foreign capital in high-tech industries was 241.8 billion yuan, a decrease of 15.6%.

The total amount of non-financial direct investment abroad for the year was 1,040.4 billion yuan, an increase of 1.6% compared to the previous year. Among this, non-financial direct investment in countries participating in the Belt and Road Initiative was 283.4 billion yuan, an increase of 18.0%.

The completed turnover of foreign contracted projects for the year was 1,277.3 billion yuan, an increase of 8.1% compared to the previous year. Among this, the completed turnover with countries participating in the Belt and Road Initiative was 1,090.2 billion yuan, an increase of 9.6%, accounting for 85.4% of the completed turnover of foreign contracted projects. Various types of labor personnel were dispatched abroad for cooperation, totaling 430,000 people.
VIII. Fiscal and Financial
The national general public budget revenue for the year was 21,604.5 billion yuan, a decrease of 1.7% compared to the previous year; among this, tax revenue was 17,636.3 billion yuan, an increase of 0.8%. The national general public budget expenditure was 28,739.5 billion yuan, an increase of 1.0% compared to the previous year. The total amount of tax reductions, fee reductions, and tax refunds from the main policies supporting technological innovation and manufacturing development throughout the year was 2,855.7 billion yuan.

Note: The data from 2021 to 2024 in the chart are the final accounts of national general public budget revenue, and 2025 is the execution number.
At the end of the year, the balance of broad money supply (M2) was 340.3 trillion yuan, an increase of 8.5% compared to the end of the previous year; the balance of narrow money supply (M1) was 115.5 trillion yuan, an increase of 3.8%; the balance of currency in circulation (M0) was 14.1 trillion yuan, an increase of 10.2%.
The annual increase in social financing scale was 35.6 trillion yuan, calculated on a comparable basis, 3.3 trillion yuan more than the previous year. At the end of the year, the stock of social financing scale was 442.1 trillion yuan, calculated on a comparable basis, an increase of 8.3% compared to the end of the previous year, among which the balance of RMB loans issued to the real economy was 268.4 trillion yuan, an increase of 6.3%. At the end of the year, the balance of deposits in all financial institutions in both domestic and foreign currencies was 336.1 trillion yuan, an increase of 27.8 trillion yuan compared to the beginning of the year, among which the balance of RMB deposits was 328.6 trillion yuan, an increase of 26.4 trillion yuan. The balance of loans in all financial institutions in both domestic and foreign currencies was 275.7 trillion yuan, an increase of 16.2 trillion yuan, among which the balance of RMB loans was 271.9 trillion yuan, an increase of 16.3 trillion yuan. The balance of RMB inclusive small and micro loans was 36.6 trillion yuan, an increase of 3.6 trillion yuan. The balance of agricultural loans in both domestic and foreign currencies was 53.6 trillion yuan, an increase of 3.4 trillion yuan; the balance of medium and long-term loans in manufacturing was 14.9 trillion yuan, an increase of 1.0 trillion yuan; the balance of green loans was 44.8 trillion yuan, an increase of 7.7 trillion yuan. The weighted average interest rate of newly issued corporate loans nationwide for the year was 3.22%, a decrease of 41 basis points compared to the previous year.

At the end of the year, the balance of RMB loans in major rural financial institutions (rural credit cooperatives, rural cooperative banks, rural commercial banks) was 33.1 trillion yuan, an increase of 1.6 trillion yuan compared to the beginning of the year. The balance of RMB consumer loans in all financial institutions was 58.2 trillion yuan, a decrease of 0.5 trillion yuan. Among this, the balance of short-term consumer loans for households was 9.5 trillion yuan, a decrease of 0.7 trillion yuan; the balance of medium and long-term consumer loans for households was 48.7 trillion yuan, an increase of 0.2 trillion yuan.
Throughout the year, the cumulative fundraising of A-shares on the Shanghai and Shenzhen Stock Exchanges was 1,258.3 billion yuan, an increase of 833.2 billion yuan compared to the previous year. The Shanghai and Shenzhen Stock Exchanges had 90 initial public offerings of A-shares, raising 124.2 billion yuan, an increase of 62 billion yuan compared to the previous year, among which 19 were on the Science and Technology Innovation Board, raising 38.1 billion yuan; the refinancing of A-shares on the Shanghai and Shenzhen Stock Exchanges (including public offerings, private placements, rights issues, preferred shares, and convertible bonds) was 1,134.1 billion yuan, an increase of 771.2 billion yuan. The Beijing Stock Exchange had 26 public offerings of stocks, raising 7.6 billion yuan, and refinancing of 0.4 billion yuan. Throughout the year, various entities raised 16.3 trillion yuan through bond issuance on the Shanghai, Shenzhen, and Beijing Stock Exchanges (including corporate bonds, enterprise bonds, asset-backed securities, government bonds, and local government bonds). The Shanghai and Shenzhen Stock Exchanges listed 20 infrastructure real estate investment trusts (REITs), raising 40.2 billion yuan. At the end of the year, there were 5,960 companies listed on the National Equities Exchange and Quotations system, with cumulative stock fundraising of 7.4 billion yuan throughout the year.
Throughout the year, 15.6 trillion yuan of corporate credit bonds were issued, an increase of 0.9 trillion yuan compared to the previous year.
The original insurance premium income of insurance companies for the year was 6,119.4 billion yuan, calculated on a comparable basis, an increase of 7.4% compared to the previous year. Among this, the original insurance premium income from life insurance business was 3,555.7 billion yuan, from health insurance and accident insurance business was 1,093.5 billion yuan, and from property insurance business was 1,470.3 billion yuan. Various types of claims and payments amounted to 2,443.2 billion yuan. Among this, payments from life insurance business were 1,001.6 billion yuan, claims and payments from health insurance and accident insurance business were 445.4 billion yuan, and claims from property insurance business were 996.2 billion yuan.
IX. Resident Income, Consumption, and Social Security
The national per capita disposable income for the year was 43,377 yuan, an increase of 5.0% compared to the previous year, with a real growth of 5.0% after deducting price factors. The median per capita disposable income of national residents was 36,231 yuan, an increase of 4.4%. By place of residence, the per capita disposable income of urban residents was 56,502 yuan, an increase of 4.3% compared to the previous year, with a real growth of 4.2% after deducting price factors. The median per capita disposable income of urban residents was 51,115 yuan, an increase of 3.7%. The per capita disposable income of rural residents was 24,456 yuan, an increase of 5.8% compared to the previous year, with a real growth of 6.0% after deducting price factors. The median per capita disposable income of rural residents was 20,711 yuan, an increase of 5.6%. The ratio of per capita disposable income between urban and rural residents was 2.31, narrowing by 0.03 compared to the previous year. According to the five income groups of national residents, the per capita disposable income of the low-income group was 10,150 yuan, the lower-middle-income group was 22,702 yuan, the middle-income group was 35,536 yuan, the upper-middle-income group was 55,586 yuan, and the high-income group was 103,778 yuan. The average monthly income of migrant workers nationwide was 5,075 yuan, an increase of 2.3% compared to the previous year. The per capita disposable income of rural residents in poverty-stricken counties was 18,627 yuan, an increase of 6.3% compared to the previous year, with a real growth of 6.5% after deducting price factors.
The national per capita consumption expenditure for the year was 29,476 yuan, an increase of 4.4% compared to the previous year, with a real growth of 4.4% after deducting price factors. Among this, the per capita service consumption expenditure was 13,602 yuan, an increase of 4.5% compared to the previous year, accounting for 46.1% of the per capita consumption expenditure of residents. By place of residence, the per capita consumption expenditure of urban residents was 35,869 yuan, an increase of 3.8% compared to the previous year, with a real growth of 3.7% after deducting price factors; the per capita consumption expenditure of rural residents was 20,259 yuan, an increase of 5.1% compared to the previous year, with a real growth of 5.3% after deducting price factors. The Engel coefficient of national residents was 29.3%, with urban residents at 28.3% and rural residents at 31.8%.

At the end of the year, the number of people participating in basic pension insurance nationwide was 1,075.99 million, an increase of 3.16 million compared to the end of the previous year, among which the number of people participating in basic pension insurance for urban employees was 546.80 million, and the number of people participating in basic pension insurance for urban and rural residents was 529.19 million. The number of people participating in basic medical insurance was 1,330.68 million, an increase of 4.06 million, among which the number of people participating in basic medical insurance for employees was 388.56 million, and the number of people participating in basic medical insurance for urban and rural residents was 942.12 million. The number of people participating in unemployment insurance was 249.18 million, an increase of 3.29 million. The number of people participating in work injury insurance was 305.00 million, an increase of 1.02 million. The number of people participating in maternity insurance was 259.66 million, an increase of 6.66 million. At the end of the year, there were 5.95 million people nationwide enjoying urban minimum living security, 33.40 million people enjoying rural minimum living security, 4.45 million people enjoying rural assistance and support for extremely poor individuals, and 23.99 million people received temporary assistance throughout the year. Throughout the year, 8.13 million retired military personnel and other preferential treatment recipients received regular pensions and living subsidies.
At the end of the year, there were 42,000 various types of civil service institutions nationwide providing accommodation, among which there were 39,000 elderly care institutions and 1,196 child welfare and rescue protection institutions. There were 7.94 million civil service beds, among which there were 7.68 million elderly care service beds and 96,000 beds in child welfare and rescue protection institutions.
X. Science, Technology, and Education
The expenditure on research and experimental development (R&D) for the year was 3,926.2 billion yuan, an increase of 8.1% compared to the previous year, accounting for 2.80% of the gross domestic product, among which the expenditure on basic research was 277.8 billion yuan, an increase of 11.1% compared to the previous year, accounting for 7.08% of R&D expenditure. The National Natural Science Foundation funded 58,800 projects. By the end of the year, there were 207 national engineering research centers under new sequence management, and 1,921 enterprise technology centers recognized by the National Development and Reform Commission. The National Science and Technology Achievement Transformation Guidance Fund had cumulatively established 36 sub-funds, with a total fund size of 62.4 billion yuan. Throughout the year, 972,000 invention patents were granted, a decrease of 7.0% compared to the previous year. The number of patent applications accepted under the Patent Cooperation Treaty (PCT) was 78,000. By the end of the year, there were 6.318 million valid invention patents, an increase of 11.1% compared to the end of the previous year. The number of high-value invention patents per 10,000 people was 16. Throughout the year, 4.206 million trademarks were registered, a decrease of 12.0% compared to the previous year. Throughout the year, 1.04 million technology contracts were signed, with a transaction amount of 7,573.4 billion yuan, an increase of 10.8% compared to the previous year. The proportion of Chinese citizens with scientific literacy reached 16.74%.

Throughout the year, 92 space launches were completed, including 50 commercial space launches. Tianwen-2 successfully embarked on a journey to sample and return from an asteroid, reusable launch vehicle technology accelerated breakthroughs, and the first flights of Zhuque-3 and Long March 12A successfully achieved second-stage orbit. The first electromagnetic catapult-type aircraft carrier "Fujian" designed and built entirely independently by China was commissioned. The superconducting quantum computing prototype "Zuchongzhi-3" was successfully constructed, China's "artificial sun" set a world record of "hundred million degrees for a thousand seconds," and the Jiangmen neutrino experiment large scientific device officially operated. The domestically developed artificial intelligence large model DeepSeek attracted global attention, the first invasive brain-computer interface clinical trial was successfully conducted, and the first domestically developed low-temperature large-beam ion implanter was capable of industrialization.
At the end of the year, there were 874 national quality inspection centers nationwide. There were 1,216 product quality, system, and service certification institutions nationwide, with certifications completed for 1.17 million enterprises. Throughout the year, 4,929 national standards were formulated and revised, among which 2,481 were newly formulated. The qualified rate of manufacturing product quality for the year was 94.36%.
Throughout the year, 1.438 million graduate students were enrolled, with 4.300 million graduate students in school, and 1.167 million graduates. Ordinary and vocational undergraduate and junior college enrollment was 10.708 million, with 39.540 million students in school, and 11.051 million graduates. Secondary vocational education enrollment was 5.265 million, with 15.378 million students in school, and 5.219 million graduates. Ordinary high school enrollment was 10.749 million, with 30.395 million students in school, and 9.246 million graduates. Junior high school enrollment was 18.528 million, with 55.093 million students in school, and 17.237 million graduates. Primary school enrollment was 14.617 million, with 101.783 million students in school, and 18.605 million graduates. Special education enrollment was 164,000, with 927,000 students in school, and 184,000 graduates. There were 32.255 million children in preschool education. The consolidation rate of nine-year compulsory education was 96.1%, and the gross enrollment rate of high school education was 92.0%. The average years of education for the population aged 16-59 was 11.3 years, an increase of 0.1 years compared to the previous year.

XI. Culture, Tourism, Health, and Sports
At the end of the year, there were 1,879 art performance groups affiliated with cultural and tourism departments nationwide. There were 3,253 public libraries nationwide, with a total circulation of 14,698.3 million person-times; 3,517 cultural centers. There were 207 million actual cable TV users, among which 200 million were actual cable digital TV users. At the end of the year, the comprehensive population coverage rate of radio programs was 99.8%, and the comprehensive population coverage rate of TV programs was 99.8%. Throughout the year, 110 TV dramas with 3,376 episodes were produced and distributed, and 336 TV animation films with 93,874 minutes were produced. 511 feature films, 253 science, documentary, animation, virtual reality, and special films were produced. Various newspapers were published with a total of 23 billion copies, various periodicals with 1.6 billion copies, and books with 10.8 billion copies (sheets), with a per capita book ownership of 7.71 copies (sheets). At the end of the year, there were 4,227 archives nationwide, with 2,672.6 million volumes (pieces) of various archives open. Throughout the year, the operating income of cultural and related industry enterprises above designated size nationwide was 15,213.5 billion yuan, calculated on a comparable basis, an increase of 7.4% compared to the previous year, among which the operating income of 16 industry subcategories with significant characteristics of new cultural formats increased by 14.3%.
Throughout the year, there were 6.52 billion domestic trips, an increase of 16.2% compared to the previous year. Among this, urban residents made 5.00 billion domestic trips, an increase of 14.3%; rural residents made 1.53 billion domestic trips, an increase of 22.6%. The total expenditure of domestic tourists was 6,300.3 billion yuan, an increase of 9.5%. Among this, urban residents' travel expenditure was 5,299 billion yuan, an increase of 7.5%; rural residents' travel expenditure was 1,001.2 billion yuan, an increase of 21.4%. There were 15.45 million inbound tourists, an increase of 17.1%, among which 3.517 million were foreigners, and 11.932 million were compatriots from Hong Kong, Macau, and Taiwan. The total expenditure of inbound tourists was 131.1 billion US dollars, an increase of 39.2%. There were 30.08 million foreigners entering through visa-free entry, an increase of 49.5%. Mainland residents made 16.792 million outbound trips, among which 16.166 million were private outbound trips, and 11.271 million were trips to Hong Kong, Macau, and Taiwan.

By the end of the year, there were a total of 1.107 million medical and health institutions nationwide, including 38,000 hospitals, of which 12,000 were public hospitals and 26,000 were private hospitals; 1.055 million primary medical and health institutions, including 33,000 township health centers, 38,000 community health service centers (stations), 424,000 outpatient departments (clinics), and 560,000 village clinics; 9,231 specialized public health institutions (excluding health supervision offices and centers), including 3,478 disease prevention and control centers. There were 13.4 million health technicians, including 5.29 million practicing doctors and assistant practicing doctors, and 6.03 million registered nurses. Medical and health institutions had 10.09 million beds, including 7.99 million in hospitals and 1.44 million in township health centers. The total number of medical consultations throughout the year was 10.58 billion, and the number of discharges was 300 million.

By the end of the year, there were a total of 5.004 million sports venues nationwide, with a total area of 4.37 billion square meters, and an average sports venue area of 3.1 square meters per person. Throughout the year, Chinese athletes won 146 world championships in 31 events, setting 17 world records. At the 9th Asian Winter Games in Harbin, Chinese athletes won a total of 32 gold medals, 27 silver medals, and 26 bronze medals, totaling 85 medals, ranking first in both the gold medal and total medal counts, achieving the best performance in the history of the Asian Winter Games. Chinese athletes with disabilities won 179 world championships in 23 international competitions.
Twelve, Resources, Environment, and Emergency Management
The total supply of state-owned construction land nationwide for the year was 471,000 hectares, a decrease of 22.2% from the previous year. Among them, land for industrial, mining, and storage purposes was 138,000 hectares, down 10.8%; land for real estate was 62,000 hectares, down 14.4%; and land for infrastructure was 272,000 hectares, down 28.4%.
The total afforestation area completed throughout the year was 3.56 million hectares, of which artificial afforestation accounted for 830,000 hectares, representing 23.2% of the total afforestation area. The area of grassland improvement was 4.93 million hectares. By the end of the year, there were a total of 5 national parks.
Preliminary calculations show that the total energy consumption for the year was 6.17 billion tons of standard coal, an increase of 3.5% from the previous year. Coal consumption increased by 0.1%, crude oil consumption increased by 3.6%, natural gas consumption increased by 2.0%, and electricity consumption increased by 5.0%. The proportion of coal consumption in the total energy consumption was 51.4%, a decrease of 1.8 percentage points from the previous year; the proportion of clean energy consumption such as natural gas, hydropower, nuclear power, wind power, and solar power in the total energy consumption was 30.4%, an increase of 1.8 percentage points. The comprehensive energy consumption per unit of calcium carbide in key energy-consuming industrial enterprises decreased by 0.7%, the comprehensive energy consumption per unit of synthetic ammonia decreased by 2.3%, the comprehensive energy consumption per ton of steel increased by 1.9%, the comprehensive energy consumption per unit of electrolytic aluminum decreased by 0.9%, and the standard coal consumption per kilowatt-hour of thermal power generation remained unchanged from the previous year. Preliminary estimates indicate that after deducting energy used as raw materials and non-fossil energy consumption, the energy consumption per 10,000 yuan of GDP nationwide decreased by 5.1% from the previous year. The carbon emission trading market nationwide had a carbon emission quota trading volume of 235 million tons, with a transaction value of 14.63 billion yuan.

Throughout the year, the area of nearshore seawater quality meeting national Class I and II seawater quality standards accounted for 84.9%, Class III seawater accounted for 4.6%, and Class IV and inferior Class IV seawater accounted for 10.5%.
Among the 339 cities at the prefecture level and above that were monitored, the annual average concentration of fine particulate matter (PM2.5) was 28.0 micrograms per cubic meter, a decrease of 4.4% from the previous year.
Among the 332 cities where daytime monitoring of urban regional acoustic environments was conducted, cities with good acoustic environment quality accounted for 9.3% throughout the year, those with relatively good quality accounted for 65.1%, those with average quality accounted for 25.0%, those with relatively poor quality accounted for 0.6%, and there were no cities with poor quality.
The average annual temperature was 10.9°C, the same as the previous year. A total of 10 typhoons made landfall.
The area of crops affected by disasters throughout the year was 6.07 million hectares, of which 690,000 hectares were completely destroyed. Direct economic losses caused by floods and geological disasters amounted to 166.6 billion yuan, losses due to drought disasters amounted to 8.6 billion yuan, losses due to low temperature freezing and snow disasters amounted to 900 million yuan, and losses due to marine disasters amounted to 8.9 billion yuan. A total of 11 earthquakes of magnitude 5.0 or above occurred, causing direct economic losses of 9.7 billion yuan. There were 225 forest fires, affecting approximately 5,000 hectares of forest area.
Throughout the year, various types of production safety accidents resulted in 18,261 deaths, a decrease of 7.0% from the previous year. The number of deaths per 100,000 employees in industrial, mining, and commercial enterprises was 1.040, a decrease of 4.5%; the number of deaths per million tons in coal mines was 0.045, a decrease of 23.7%. The number of deaths per 10,000 vehicles in road traffic accidents was 1.25, a decrease of 4.6%.
Notes:
[1] All data in this bulletin are preliminary statistics. All statistical data do not include the Hong Kong Special Administrative Region, the Macao Special Administrative Region, and Taiwan Province. Some data may not add up to the total due to rounding.
[2] The absolute values of GDP, the added value of the three industries and related industries, regional GDP, per capita GDP, and gross national income are calculated at current prices, while growth rates are calculated at constant prices.
[3] Gross national income, formerly known as gross national product, refers to the total primary distribution income obtained by all resident units of a country or region within a certain period, equal to GDP plus net primary distribution income from abroad.
[4] Total labor productivity is the ratio of GDP (calculated at 2020 prices) to the total number of employed persons.
[5] The national population refers to the population of the 31 provinces, autonomous regions, and municipalities directly under the central government of mainland China, and active military personnel, excluding Hong Kong, Macao, and Taiwan residents and foreign nationals residing in the 31 provinces, autonomous regions, and municipalities directly under the central government.
[6] By the end of 2025, the population aged 0-14 (including those under 15 years old) was 212.76 million, and the population aged 15-59 (including those under 60 years old) was 868.75 million.
[7] The number of new urban jobs refers to the difference between the cumulative number of new employees in urban areas during the reporting period and the number of natural attritions.
[8] The annual number of migrant workers includes those who have worked outside their hometown for six months or more and local migrant workers engaged in non-agricultural industries within their hometown for six months or more.
[9] The producer price of agricultural products refers to the actual unit product price obtained by agricultural producers when they first sell their products.
[10] Housing prices include rental housing rent, housing maintenance and management, water, electricity, and fuel, and self-owned housing service prices.
[11] Due to changes in the survey scope stipulated by the statistical survey system, statistical law enforcement, and the removal of duplicate data, the growth rate and changes of relevant indicators for industries above designated size in 2025 are calculated on a comparable basis.
[12] The equipment manufacturing industry includes the metal products industry, general equipment manufacturing industry, special equipment manufacturing industry, automobile manufacturing industry, railway, ship, aerospace, and other transportation equipment manufacturing industry, electrical machinery and equipment manufacturing industry, computer, communication, and other electronic equipment manufacturing industry, and instrument manufacturing industry.
[13] The high-tech manufacturing industry includes the pharmaceutical manufacturing industry, aerospace and equipment manufacturing industry, electronic and communication equipment manufacturing industry, computer and office equipment manufacturing industry, medical instrument equipment and instrument manufacturing industry, and information chemical manufacturing industry.
[14] The digital product manufacturing industry includes computer manufacturing, communication and radar equipment manufacturing, digital media equipment manufacturing, smart device manufacturing, electronic components and equipment manufacturing, and other digital product manufacturing industries.
[15] The statistical scope of enterprises above designated size in some service industries includes transportation, warehousing, and postal industries with annual operating income of 20 million yuan or more, information transmission, software and information technology service industries, water conservancy, environment, and public facility management industries, and health industry legal entities; real estate industry (excluding real estate development and operation), leasing and business service industries, scientific research and technical service industries, and education industry legal entities with annual operating income of 10 million yuan or more; and resident services, repair, and other service industries, culture, sports, and entertainment industries, and social work industry legal entities with annual operating income of 5 million yuan or more. Financial industry, wholesale and retail industry, accommodation and catering industry, and real estate development and operation industry legal entities are not included. The growth rate of financial indicators for enterprises above designated size in some service industries in 2025 is calculated on a comparable basis.
[16] Strategic emerging service industries include service-related industries in the eight major industries of the new generation information technology industry, high-end equipment manufacturing industry, new materials industry, biological industry, new energy vehicle industry, new energy industry, energy-saving and environmental protection industry, and digital creative industry, as well as new technology and innovation and entrepreneurship-related service industries.
[17] High-tech service industries include information services, e-commerce services, inspection and testing services, high-tech services in professional technical services, research and design services, technology achievement transformation services, intellectual property and related legal services, and environmental monitoring and governance services.
[18] E-commerce transaction volume refers to the transaction volume of goods and services realized through e-commerce trading platforms (including self-built platforms and third-party platforms), including transactions with units and individuals, with the growth rate in 2025 calculated on a comparable basis.
[19] Online retail sales refer to the retail sales of goods and services realized through public network trading platforms (mainly online platforms engaged in physical goods transactions, including self-built websites and third-party platforms), with the growth rate in 2025 calculated on a comparable basis.
[20] Due to the reform of the investment statistical system and methods, statistical law enforcement inspections, and other factors, the growth rate of relevant indicators for fixed asset investment in 2025 is calculated on a comparable basis.
[21] The eastern region refers to the 10 provinces (cities) of Beijing, Tianjin, Hebei, Shanghai, Jiangsu, Zhejiang, Fujian, Shandong, Guangdong, and Hainan; the central region refers to the 6 provinces of Shanxi, Anhui, Jiangxi, Henan, Hubei, and Hunan; the western region refers to the 12 provinces (autonomous regions, municipalities) of Inner Mongolia, Guangxi, Chongqing, Sichuan, Guizhou, Yunnan, Tibet, Shaanxi, Gansu, Qinghai, Ningxia, and Xinjiang; the northeastern region refers to the 3 provinces of Liaoning, Jilin, and Heilongjiang.
[22] The calculation scope of carbon dioxide emissions per 10,000 yuan of GDP includes carbon dioxide emissions from energy activities and industrial production processes, calculated at 2020 prices.
[23] See note [11].
[24] Steel production data includes steel reprocessed between enterprises.
[25] See note [11].
[26] Capacity utilization rate refers to the ratio of actual output to production capacity (both measured in value terms). The actual output of an enterprise refers to the total industrial output value of the enterprise during the reporting period; the production capacity of an enterprise refers to the product output that the enterprise can achieve and maintain for a long time during the reporting period, under the condition that labor, raw materials, fuel, transportation, and other supplies are guaranteed, and production equipment (machinery) is operating normally.
[27] Thermal power includes coal-fired power generation, oil-fired power generation, gas-fired power generation, waste heat, waste pressure, waste gas power generation, and biomass power generation.
[28] A small amount of installed power generation capacity (such as geothermal, etc.) is not listed in the bulletin.
[29] Due to statistical law enforcement inspections, the removal of duplicate data, and other factors, the growth rate of profits for construction enterprises in 2025 is calculated on a comparable basis.
[30] See note [15].
[31] The total volume and turnover of freight transport include the completion volume of five modes of transport: railway, highway, waterway, civil aviation, and pipeline, with the growth rate in 2025 calculated on a comparable basis.
[32] In 2025, the passenger coefficient for online ride-hailing was adjusted, and corresponding adjustments were made to the data for urban taxi passenger transport volume and other indicators for the current year and the same period of the previous year. The growth rate of total passenger transport volume, passenger transport turnover, highway passenger transport volume, and highway passenger transport turnover in 2025 is calculated on a comparable basis.
[33] The total volume of postal industry delivery business refers to the total quantity of various postal universal service businesses and express delivery businesses conducted by enterprises.
[34] The total volume of telecommunications business is calculated at the previous year's prices.
[35] The number of mobile phone base stations refers to the number of wireless transceiver equipment serving cells at the end of the reporting period, which handles wireless communication between the base station and mobile stations, acts as a relay between the mobile switch and mobile stations, and monitors the quality of wireless transmission.
[36] Fixed internet broadband access users refer to users registered with telecommunications companies at the end of the reporting period, accessing the public internet through xDSL, FTTx+LAN, FTTH/O, and other broadband access methods and ordinary dedicated lines.
[37] Broadband access users with a speed of 1000M or above refer to broadband access users with a downstream speed greater than or equal to 1000Mbit/s at the end of the reporting period.
[38] Mobile IoT terminal users refer to users who access the mobile communication network and have activated IoT services at the end of the reporting period. IoT terminals connect the sensor network layer and the transmission network layer, achieving remote data collection and sending data to the network layer.
[39] The software and information technology service industry includes software development, integrated circuit design, information system integration and IoT technology services, operation and maintenance services, information processing and storage support services, information technology consulting services, digital content services, and other information technology services. The growth rate of software business revenue completed by the software and information technology service industry in 2025 is calculated on a comparable basis.
[40] In 2024, the statistical caliber of express business volume was adjusted, and the growth rate for that year is calculated on a comparable basis.
[41] Service retail sales refer to the total value of services provided directly to individuals and other units for non-production and non-operating use by enterprises (industrial activity units, individual businesses) in the form of transactions, aiming to reflect the service value sold by service providers in monetary form, including retail sales of service activities in fields such as transportation, accommodation, catering, education, health, sports, and entertainment.
[42] See note [19].
[43] See note [20].
[44] See note [21].
[45] Infrastructure investment includes investment in railway transportation, road transportation, water transportation, air transportation, pipeline transportation, multimodal transport and transportation agency, loading and unloading handling, postal services, telecommunications broadcasting and satellite transmission services, internet and related services, water conservancy management, ecological protection and environmental governance, and public facility management.
[46] Social sector investment includes investment in education, health and social work, culture, sports, and entertainment industries.
[47]Private investment refers to the investment in fixed assets within the country by domestic survey units with collective, private, or individual nature, as well as survey units controlled by them (including absolute and relative control).
[48]Real estate industry investment, in addition to real estate development investment, also includes self-built housing by construction units, property management, intermediary services, and other real estate investments.
[49]According to the real estate development statistical system, statistical law enforcement inspections, and other regulations, data such as real estate development investment and new commercial housing sales area from the same period last year are revised, and the growth rate for 2025 is calculated on a comparable basis.
[50]The sales area of newly built commercial housing refers to the total contract area of newly built commercial houses sold by real estate development enterprises during the reporting period.
[51]The net signed area of second-hand housing transactions refers to the total area of urban second-hand housing net signed transaction contracts during the reporting period.
[52]Other member countries of the Regional Comprehensive Economic Partnership (RCEP) include Brunei, Myanmar, Cambodia, Indonesia, Laos, Malaysia, the Philippines, Singapore, Thailand, Vietnam, Japan, South Korea, Australia, and New Zealand.
[53]Starting from January 2025, the People's Bank of China will adopt a newly revised narrow money (M1) statistical caliber. The revised M1 includes currency in circulation (M0), unit demand deposits, personal demand deposits, and customer reserve funds of non-bank payment institutions, with the growth rate for 2025 calculated on a comparable basis.
[54]The increment of social financing scale refers to the total amount of funds obtained by the real economy from the financial system during a certain period.
[55]The stock of social financing scale refers to the balance of funds obtained by the real economy from the financial system at the end of a certain period (end of month, quarter, or year).
[56]Inclusive micro and small loans include loans to micro and small enterprises with single credit less than 10 million yuan, operating loans for individual businesses, and operating loans for micro and small enterprise owners.
[57]The weighted average interest rate of newly issued enterprise loans refers to the weighted average interest rate calculated based on the amount of newly issued enterprise loans (in both domestic and foreign currencies) throughout the year.
[58]The stock financing amount of the Shanghai and Shenzhen Stock Exchanges is calculated based on the listing date, and the financing amount includes the actual conversion amount of convertible bonds, which are 169.4 billion yuan and 226.7 billion yuan for 2024 and 2025, respectively.
[59]The stock financing amount of the Beijing Stock Exchange is calculated based on the listing date.
[60]The cumulative financing of companies listed on the National Equities Exchange and Quotations does not include preferred stocks, and stock financing is calculated based on the listing date of new shares.
[61]Corporate credit bonds include debt financing instruments for non-financial enterprises, corporate bonds, and company bonds, convertible bonds, etc.
[62]Original insurance premium income refers to the premium income confirmed by insurance companies from original insurance contracts.
[63]The median of per capita disposable income refers to the per capita disposable income of the household in the middle position when all surveyed households are arranged in order of per capita income level from low to high.
[64]The national residents' quintile income grouping refers to dividing all surveyed households into five equal parts based on per capita income level from low to high. The households in the lowest 20% income are the low-income group, followed by the lower-middle income group, middle-income group, upper-middle income group, and high-income group.
[65]Poverty-stricken counties include the original 832 key counties for national poverty alleviation and development work and counties in concentrated contiguous poverty-stricken areas, as well as 7 cities and counties in the Aksu region of Xinjiang.
[66]Service consumption expenditure refers to household consumption expenditure on various life services, including catering services, clothing and footwear processing services, housing services, household services, transportation and communication services, education, culture and entertainment services, medical services, and other services.
[67]Rural destitute persons refer to rural elderly, disabled persons, and minors under 16 years old who have no ability to work, no source of livelihood, and no legal obligor for support, or whose legal obligor has no ability to fulfill obligations.
[68]Temporary assistance includes emergency and transitional assistance provided by the state to families or individuals whose basic living has fallen into difficulty due to sudden events, accidental injuries, major diseases, or other special reasons, and other social assistance systems cannot temporarily cover or after assistance, basic living still faces serious difficulties, as well as winter heating assistance, temporary price subsidies, holiday visits, and other temporary assistance.
[69]Beds in civil affairs services, excluding adoption institutions, also include beds in rescue institutions and community institutions.
[70]PCT (Patent Cooperation Treaty) is an international cooperation treaty in the field of patents. The number of PCT patent applications received refers to the number of PCT patent applications received by the State Intellectual Property Office as the receiving office for PCT patent applications.
[71]The number of high-value invention patents per 10,000 people refers to the number of valid invention patents owned by domestic residents per 10,000 people authorized by the State Intellectual Property Office that meet any of the following conditions: invention patents in strategic emerging industries; invention patents with family patent rights overseas; invention patents maintained for more than 10 years; invention patents achieving high pledge financing amounts; invention patents awarded the National Science and Technology Award or the China Patent Award.
[72]Citizens with scientific literacy refer to those who uphold the spirit of science, establish scientific thinking, master basic scientific methods, understand necessary technological knowledge, and have the ability to apply them to analyze and judge things and solve practical problems.
[73]The qualified rate of manufacturing product quality refers to the percentage of samples judged as quality qualified among all sampled samples through quality sampling inspection implemented according to prescribed methods, procedures, and standards.
[74]General and vocational undergraduate and junior college education includes general undergraduate, vocational undergraduate, and higher vocational (junior college).
[75]Secondary vocational education includes general secondary vocational schools, adult secondary vocational schools, vocational high schools, and technical schools.
[76]Total circulation refers to the total number of people receiving library services at library venues within the year, including borrowing books and periodicals, consulting questions, and participating in various reader activities.
[77]Virtual reality films refer to new forms of movies produced using virtual reality (including augmented reality, mixed reality) technologies, viewed through head-mounted display devices and other virtual reality terminals, and publicly screened in fixed venues such as cinemas.
[78]Special films refer to films that adopt different movie display methods in terms of technology, equipment, and programs compared to conventional cinema screenings, such as giant screen movies, stereoscopic special effects (4D) movies, dynamic movies, dome movies, etc.
[79]Per capita book ownership refers to the number of books published in the current year that the average person nationwide can own within one year.
[80]The 16 industry subcategories with distinct characteristics of new cultural formats are: broadcast television integration and control, internet search services, other internet information services, digital publishing, other cultural and artistic industries, animation, game digital content services, internet game services, multimedia, game animation and digital publishing software development, value-added telecom cultural services, other cultural digital content services, internet advertising services, internet cultural platforms, copyright and cultural software services, manufacturing of intelligent unmanned aerial vehicles for entertainment, manufacturing of wearable intelligent cultural devices, manufacturing of other intelligent cultural consumer devices.
[81]Total number of medical visits refers to the total number of people receiving medical services, including outpatient, emergency, home visits, appointment diagnosis and treatment, single-item health checks, health consultation and guidance (excluding health lectures, nucleic acid testing).
[82]Number of discharges refers to the total number of people discharged after hospitalization during the reporting period, including those discharged on medical advice, transferred to other medical institutions on medical advice, discharged without medical advice, deaths, and other numbers, excluding the number of family bed withdrawals.
[83]Sports venue survey objects do not include sports venues belonging to the military and railway systems.
[84]Sports venue area refers to the effective area of sports training, competition, and fitness venues.
[85]The total supply of state-owned construction land refers to the total amount of state-owned construction land for which municipal and county people's governments sign transfer contracts or issue allocation decisions and complete transactions with land-use units or individuals according to the annual land supply plan during the reporting period.
[86]Real estate land refers to the total of commercial service land and residential land.
[87]Grassland improvement area refers to the total area of grassland ecological restoration through measures such as artificial grass planting, aerial seeding, grassland improvement, and enclosure protection.
[88]Energy consumption per 10,000 yuan of GDP is calculated at 2020 prices.
[89]The carbon emission quota in the national carbon emission trading market refers to the emission quota of carbon dioxide and other greenhouse gases allocated to key emission units in the national carbon emission trading market for a specified period. One unit of carbon emission quota is equivalent to the emission of one ton of carbon dioxide equivalent into the atmosphere.
[90]The water quality of nearshore sea areas is evaluated using the area method.
-
"Winning Aspiration" ship docks first, Yantai Port sets a new record for single-ship bauxite unloading.4685
-
Ningbo Waterborne Radio Monitoring Drill Protects Fishing Season Opening3540
-
Jiangsu plans full coverage of meteorological perception and early warning in key waterways.3129
-
The world's largest intelligent, eco-friendly, multifunctional dredging vessel model debuts at the China Maritime Museum.3583
-
Bohai Bay Port strives to become a benchmark for the transformation of small and medium-sized ports.4170